[ad_1]
Stock investors loved Alan Greenspan because the policies he pursued during his tenure as chair of the US Federal Reserve benefited the equity markets. At least that was the conventional wisdom.
But did the markets reflect this narrative on days when Greenspan testified before Congress? Did they tend to go up as we would expect, or did their performance contradict the narrative? And how did the markets respond when Jerome Powell and other Fed chairs testified? What does their behavior reveal about how they assessed each Fed chair?
To answer these questions, we pulled S&P 500 and MSCI market and asset class data for all dates on which the last five Fed chairs testified before Congress and compared the results with both daily average returns and average return volatility.
To better isolate market sentiment around each Fed chair, we did not include Fed rate announcement days in our analysis. The Fed had already communicated its rate decisions to the public prior to each Fed chair’s congressional appearance, and the market had presumably taken the decision — to hike, hold, or reduce rates — into account.
So, how did the markets respond to the testimony of each Fed chair? Were there any standouts or surprises?
As it turns out, Janet Yellen generated the most positive returns on the days when she testified relative to the four other Fed chiefs. On average, the S&P 500 rose 0.20% when Yellen spoke and only 0.08% when Greenspan testified.
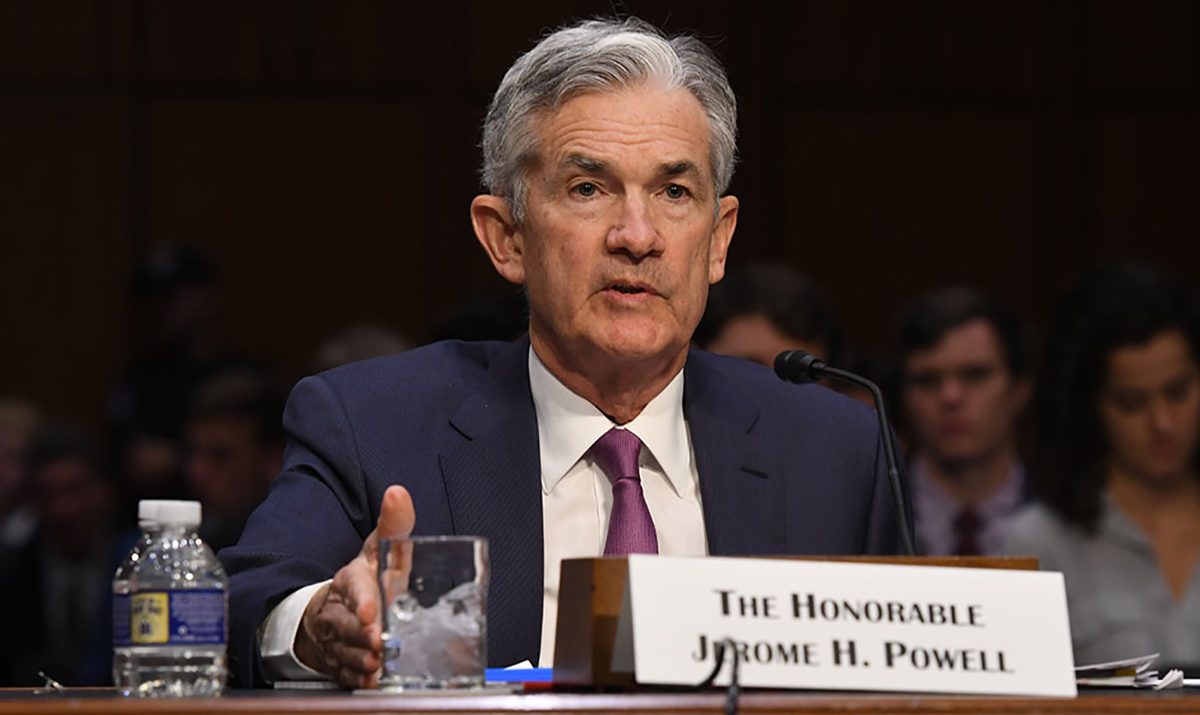
On the other end of the spectrum, days when Ben Bernanke or Powell testified are associated with more negative stock market performance. The S&P 500 returned –0.05% on average on days when Powell or Bernanke appeared before Congress. Of course, Bernanke helmed the Fed during the global financial crisis (GFC) and Powell during a period of resurgent inflation. So, the bearishness they evoked may not be especially surprising.
Fed Chair Congressional Testimony Average Returns: One-Day Window (%)
| Paul Volcker |
Alan Greenspan |
Ben Bernanke |
Janet Yellen |
Jerome Powell |
|
| S&P 500 | –0.03 | 0.08 | –0.05 | 0.20 | –0.05 |
| Small-Cap Equity |
0.04 | 0.06 | –0.15 | 0.07 | 0.00 |
| Growth Equity |
–0.03 | -0.02 | –0.01 | 0.08 | –0.11 |
| Value Equity |
0.00 | 0.03 | –0.08 | 0.28 | 0.06 |
| International Equity |
0.10 | –0.02 | 0.01 | 0.05 | –0.23 |
| Total Bond Index |
0.07 | 0.03 | 0.09 | –0.05 | 0.01 |
| High-Yield Debt |
0.06 | 0.04 | 0.02 | 0.09 | 0.00 |
| Short-Term Debt |
0.02 | 0.02 | 0.01 | –0.01 | -0.01 |
We see similar results play out across small-cap and international equities as well as value and growth, with Yellen testimony days yielding better returns than Greenspan’s. We repeated our tests over a three-day window around the Fed chairs’ congressional testimony and again generated qualitatively similar outcomes.
Bonds told a distinctly different story, however. While equities outperformed when Yellen testified, fixed income went in the opposite direction, with the total bond index returning –0.05% on days when Yellen appeared before Congress.
Volatility was another datapoint we explored, with Bernanke testimony days displaying the most volatility overall.
Standard Deviation of Returns around Fed Chair Testimony Days
| Paul Volcker |
Alan Greenspan |
Ben Bernanke |
Janet Yellen |
Jerome Powell |
|
| S&P 500 | 0.88 | 0.93 | 1.40 | 0.52 | 0.77 |
| Small-Cap Equity |
0.57 | 0.86 | 1.72 | 0.67 | 0.91 |
| Growth Equity |
0.35 | 1.17 | 1.30 | 0.82 | 0.85 |
| Value Equity |
0.93 | 0.93 | 1.56 | 0.55 | 0.83 |
| International Equity |
0.55 | 0.84 | 1.37 | 0.81 | 0.97 |
| Total Bond Index |
0.16 | 0.29 | 0.27 | 0.25 | 0.17 |
| High-Yield Debt |
0.18 | 0.23 | 0.35 | 0.11 | 0.12 |
| Short-Term Debt |
0.08 | 0.08 | 0.04 | 0.04 | 0.03 |
Of all the Fed chairs, Yellen generated the most positive stock market reactions and the least volatility over the past 50 years, even as bond investors tended to respond negatively to her testimony.
Otherwise, both Powell’s and Paul Volcker’s tenures featured a number of interest rate hikes in response to rising inflation. The weaker performance of equities on their testimony days may reflect how the markets came to associate them both with higher rates.
If you liked this post, don’t forget to subscribe to the Enterprising Investor.
All posts are the opinion of the author(s). As such, they should not be construed as investment advice, nor do the opinions expressed necessarily reflect the views of CFA Institute or the author’s employer.
Image courtesy of the US Federal Reserve
Professional Learning for CFA Institute Members
CFA Institute members are empowered to self-determine and self-report professional learning (PL) credits earned, including content on Enterprising Investor. Members can record credits easily using their online PL tracker.
[ad_2]
Source link


 Bitcoin
  Tether
  XRP
XRP  USDC
USDC  Lido Staked Ether
  Dogecoin
  LEO Token